Common Size Balance Sheet Vs Traditional Balance Sheet

Common Size Balance Sheet Vs Traditional Balance Sheet: Which One is Better?

admin April 21, 2025
Common Size Balance Sheet Vs Traditional Balance Sheet

A Common Size Balance Sheet presents each item as a percentage of total assets, allowing for easy comparison across companies or periods, regardless of size. In contrast, a Traditional Balance Sheet lists actual dollar values for assets, liabilities, and equity, giving a snapshot of a company’s financial position at a specific point in time. While the Traditional Balance Sheet provides detailed financial data, the Common Size Balance Sheet helps in analyzing structural trends and efficiency by standardizing figures, making it a useful tool for benchmarking and financial analysis.

When analyzing a company’s financial health, balance sheets are indispensable. However, not all balance sheets are created equal. The Common Size Balance Sheet vs Traditional Balance Sheet comparison highlights how each format serves distinct purposes. A Traditional Balance Sheet provides a detailed snapshot of a company’s financial position using absolute dollar amounts, making it ideal for reviewing actual asset values, liabilities, and equity. In contrast, a Common Size Balance Sheet expresses each line item as a percentage of total assets, which allows for easier comparison across companies or time periods, regardless of size. Understanding the strengths, limitations, and ideal use cases of each helps investors, analysts, and business leaders determine which format is better suited for specific financial analysis scenarios. This blog explores both formats to provide clarity on when and why to use each one.
What is a Traditional Balance Sheet?

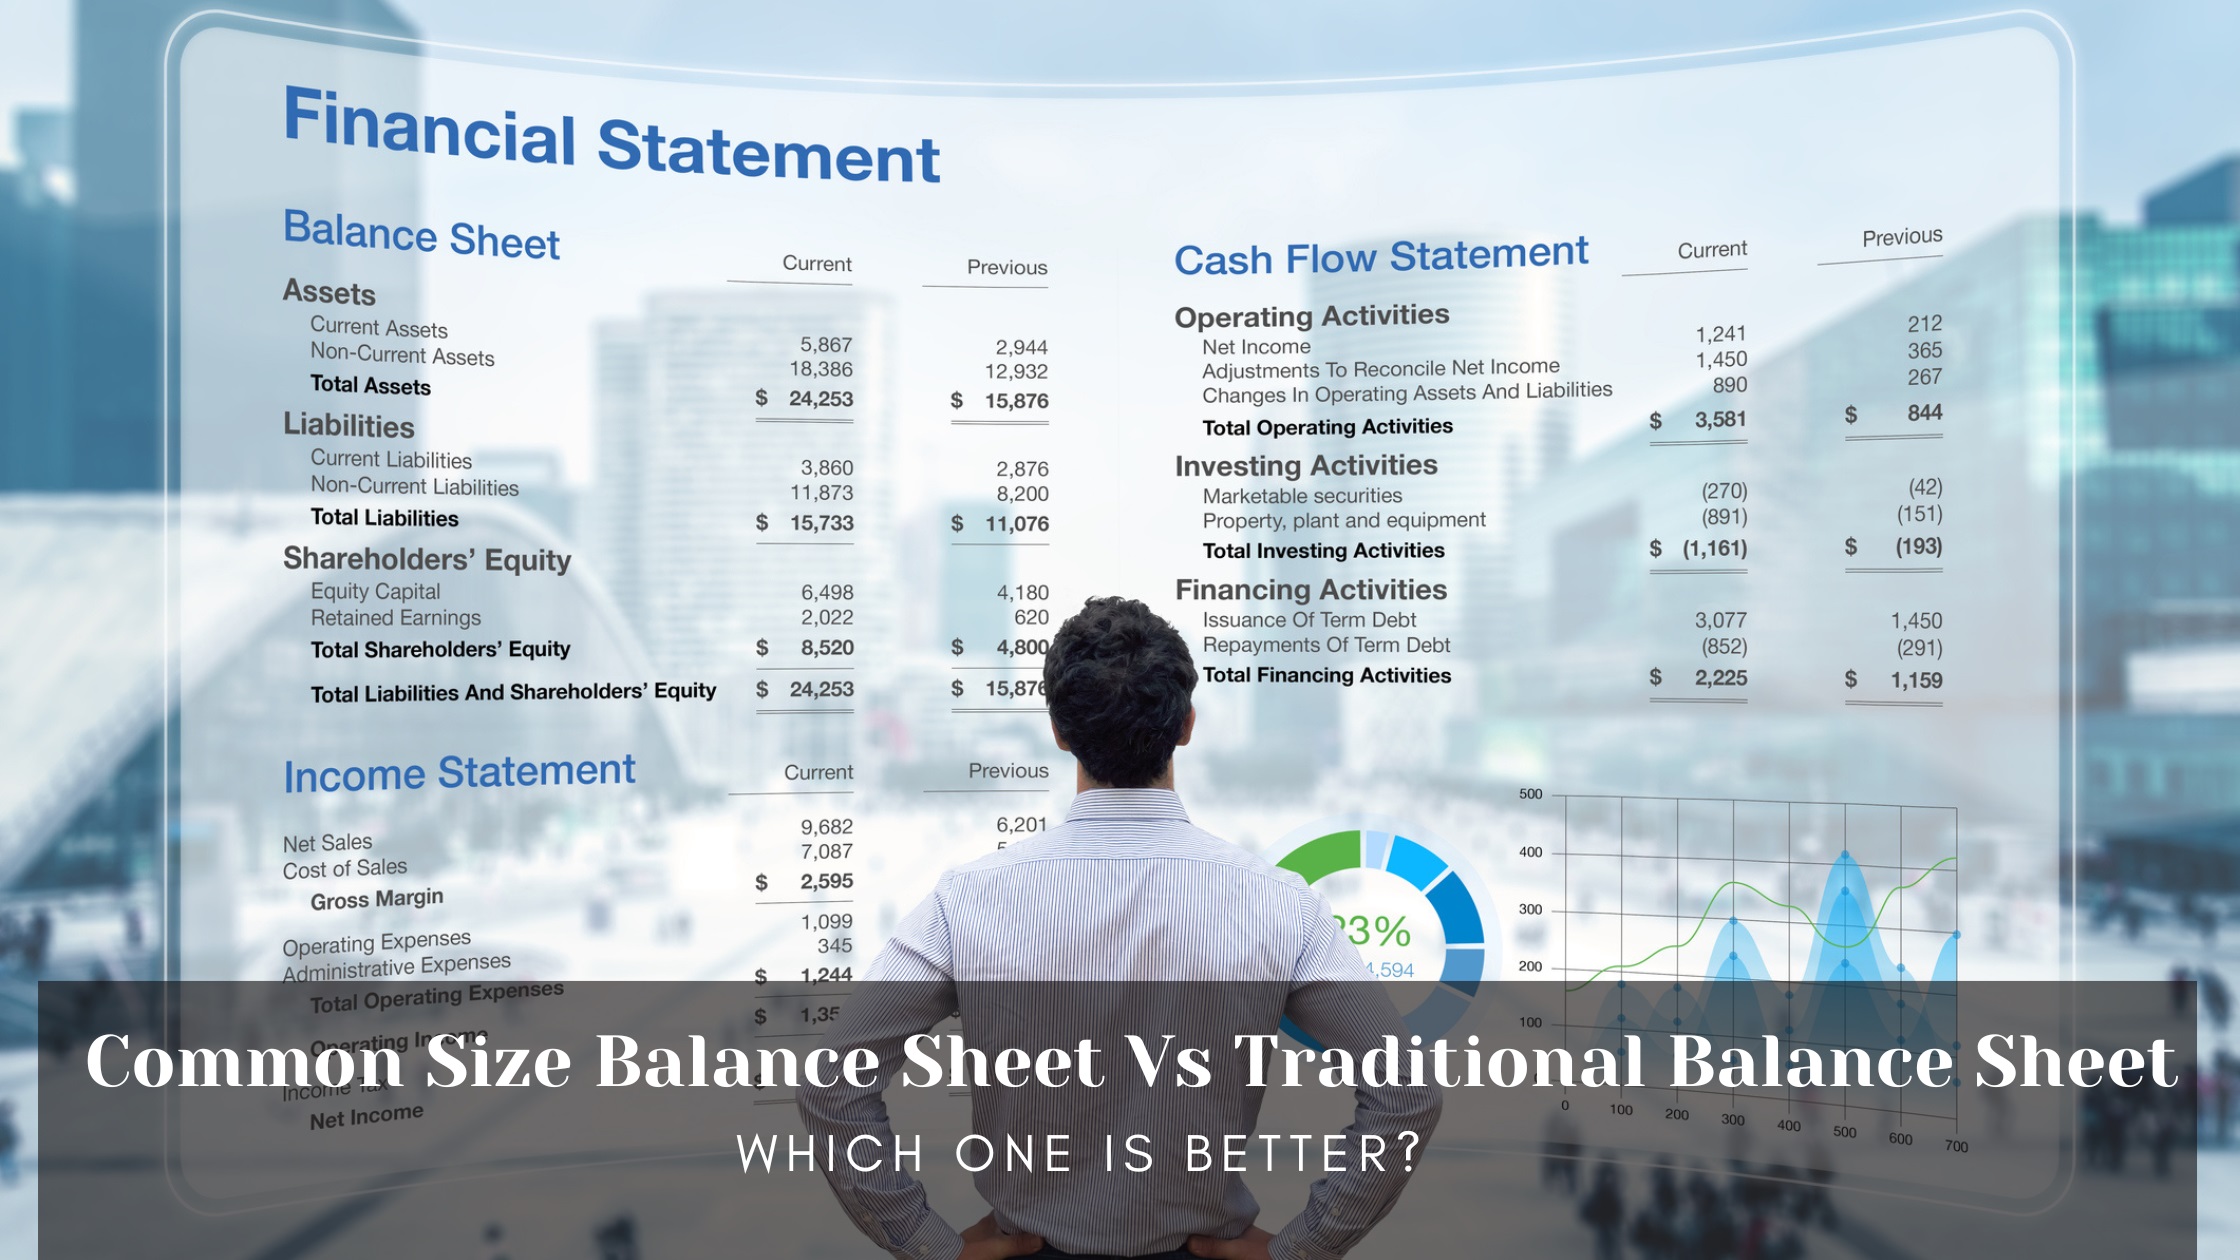
A traditional balance sheet is a financial statement that reports a company’s assets, liabilities, and equity in absolute dollar amounts at a specific point in time. It follows the fundamental accounting equation:  

$$ \text{Assets} = \text{Liabilities} + \text{Shareholders’ Equity} $$  

Key Features:  

– Lists assets (current and non-current) on the left or top.  

– Details liabilities (current and long-term) and equity on the right or bottom.  

– Presents raw monetary values, such as cash ($1 million) or accounts payable ($500,000).  

While straightforward, comparing traditional balance sheets of companies with different sizes or industries can be challenging. For example, a $10 million inventory might represent 50% of a small retailer’s assets but only 5% of a multinational corporation’s assets.

What is a Common Size Balance Sheet?

A common size balance sheet converts each line item into a percentage of total assets, standardizing the data for easier analysis. For instance, if a company has $8 million in total assets and $1 million in cash, cash is presented as 12.5% of total assets.  

Key Features:

– Each asset, liability, and equity item is expressed as a percentage of total assets.  

– Uses the formula:  

$$ \text{Common Size Percentage} = \left( \frac{\text{Line Item}}{\text{Total Assets}} \right) \times 100 $$  

– Highlights structural composition (e.g., 30% of assets in inventory vs. 10% in property).  

This format is particularly useful for comparing companies of varying sizes or tracking a company’s financial trends over time.

Key Differences: Common Size vs. Traditional Balance Sheets

Aspect  Traditional Balance Sheet  Common Size Balance Sheet
Presentation  Dollar amounts  Percentages of total assets
Comparability  Challenging across different sizes Standardized for easy comparison 
Focus  Absolute values                      Relative proportions
Use Case  Regulatory reporting, basic analysis Trend analysis, cross-company comparisons
GAAP Compliance  Required  Optional, used for internal analysis

When to Use a Traditional Balance Sheet

  1. Regulatory Compliance: GAAP and IFRS require traditional balance sheets for official financial reporting.  
  2. Assessing Absolute Values: Useful for evaluating liquidity (e.g., cash reserves) or debt obligations in dollar terms.  
  3. Internal Budgeting: Helps managers allocate resources based on actual monetary figures.  

Example: A lender reviewing a $500,000 loan application needs to see the borrower’s exact liabilities and collateral value.

When to Use a Common Size Balance Sheet

  1. Cross-Company Comparisons: By converting data to percentages, analysts compare a small tech startup’s asset structure to an industry giant’s.  
  2. Identifying Trends: Tracking whether inventory (as a percentage of assets) is rising or falling over five years.  
  3. Benchmarking: Evaluating if a company’s debt-to-assets ratio aligns with industry standards.  


Example: If Company A’s accounts receivable represent 20% of assets versus Company B’s 35%, it may signal differences in credit policies.

Advantages of a Common Size Balance Sheet

  1. Normalizes Data: Eliminates size differences, enabling apples-to-apples comparisons[4][6].  
  2. Simplifies Trend Analysis: Percentages reveal whether specific assets or liabilities are growing disproportionately.  
  3. Highlights Structural Shifts: A sudden spike in debt percentage could signal financial risk.  
  4. User-Friendly for Stakeholders: Investors quickly grasp proportional investments in assets like equipment or inventory.

Limitations of a Common Size Balance Sheet

  1. Ignore Absolute Values: A 10% cash holding might be $1 million for one company and $100 million for another.  
  2. Vulnerable to Manipulation: “Window dressing” tactics can distort percentages, such as temporarily reducing liabilities before reporting.  
  3. No Insight into Profitability: Focuses on balance sheet structure, not income or cash flows.  
  4. Fails to Account for Inflation: Historical cost accounting may understate asset values in inflationary environments.

Advantages of a Traditional Balance Sheet

  1. Shows Absolute Values: Presents assets, liabilities, and equity in actual dollar amounts, providing a clear picture of the company’s financial position at a specific point in time.
  2. Required for Compliance: Meets regulatory and statutory reporting requirements under GAAP and IFRS, making it essential for audits and official filings.
  3. Facilitates Liquidity and Solvency Analysis: Enables calculation of key financial ratios (e.g., current ratio, debt-to-equity) that assess liquidity and solvency, which cannot be directly derived from a common size balance sheet.
  4. Useful for Internal Decision-Making: Provides management with concrete figures for budgeting, forecasting, and resource allocation.

Limitations of a Traditional Balance Sheet

  1. Difficult Comparisons Across Companies: Raw figures make it challenging to compare companies of different sizes or industries, as scale differences can obscure meaningful analysis.
  2. Limited Trend Analysis: Does not easily highlight structural changes or trends in asset and liability composition over time without additional calculations.
  3. May Obscure Proportional Risks: Large dollar values can mask the relative size or risk of certain items, such as a high percentage of debt or inventory.
  4. No Standardization for Benchmarking: Lacks the standardized format needed for easy benchmarking against industry averages or competitors.

Which One is Better? Context is Key

Neither format is universally superior—the choice depends on the analysis goal:  

– Choose a Traditional Balance Sheet If: 

  – You need compliance with reporting standards.  

  – Absolute liquidity or solvency metrics (e.g., debt-to-equity ratio) are critical.  

– Choose a Common Size Balance Sheet If:  

  – Comparing companies of different sizes or industries.  

  – Analyzing structural changes in assets/liabilities over time.  

For comprehensive insights, many analysts use both formats. For example, a traditional balance sheet reveals a company has $2 million in debt, while the common size version shows debt represents 40% of assets—a red flag if the industry average is 25%.

How to Prepare a Common Size Balance Sheet

  1. Gather Data: Start with a traditional balance sheet.  
  2. Calculate Percentages: Divide each line item by total assets and multiply by 100.  

   $$ \text{Cash \%} = \left( \frac{\text{Cash}}{\text{Total Assets}} \right) \times 100 $$  

  1. Present Side-by-Side: Include percentages next to dollar amounts for clarity.  

FAQs

Ques: Can a common size balance sheet replace a traditional one?

No. Traditional balance sheets are required for regulatory compliance, while common size versions are supplementary tools for analysis.

Ques: How does a common size balance sheet help in benchmarking?

By expressing items as percentages, it lets analysts compare companies regardless of size. For example, a 15% debt ratio can be evaluated against industry averages.

Ques: What are the limitations of using only a traditional balance sheet?  

It doesn’t reveal proportional trends, making it harder to spot issues like over-reliance on inventory or rising debt levels relative to assets.

Ques: When should a company use both balance sheet formats?  

Combining both provides a complete picture: absolute values for liquidity assessment and percentages for structural analysis. This is ideal for investor reports or internal audits.

Conclusion

The common size balance sheet excels in comparative and trend analysis, while the traditional balance sheet remains essential for regulatory compliance and absolute value assessment. For most stakeholders, using both formats offers the deepest insights. By standardizing data into percentages, the common size version demystifies financial structures, but it’s no substitute for the concrete figures provided by its traditional counterpart. Whether you’re a CFO or an investor, understanding both tools ensures you’re equipped to make data-driven decisions in any financial landscape.

Expand Your Skills with Relevant Courses


Recent Post

Keep Connection,
Subscribe Now!

Enter Your Email Address